Who can use this feature:
🥇Accounts on the Starters/Mains (with "Operations" add on) or All You Can Eat plans.
🔐Users with access to Operation Reporting permissions.
Jump to:
- Introduction
- When am I ready to check my Stock Variances?
- The Stock Reconciliation process:
- Third Party Stock Audits
Introduction
The ability to understand the granular detail of how much individual items and ingredients cost to make, the profit margin, wastage, discounts, supplier costs and stock loss are key within hospitality to informing good operational decisions moving forward.
To make use of the Kobas Stock system, you will need to ensure that you understand how the system interacts with your EPoS Items, and have it all set up. This article explains how to analyse and understand the information we provide based on your movements within the stock system. You can find more information on our stock system in the Operations section of the Knowledge Base.
Please take a look here to see how Kobas calculates your stock values.

When am I ready to check my Stock variances?
Before you are ready to report on your Stock and investigate variances, the following needs to be done:
- All deliveries are recorded for the venue for the period in question
- All ingredients, batches, and EPoS Items are set up correctly
- All Other Stock Usage (waste and free items) have been recorded accurately for the period
- A Stock Check has been recorded, and there is a corresponding Stock Check at the end of the previous stock period for you to compare.
- You have the appropriate Staff User Permission Level to see the information.
These processes can all be amended or completed retrospectively if required.
Once these are all complete, you are ready to go!
The stock reconciliation process
Step 1: The Stock Usage Comparison Report (SUCR)
You will need to start by running this report here Reports > Operation Analysis > Stock Usage Comparison. You will then see some information about the report, and you will need to select the Venue and the two Stock Checks to compare.
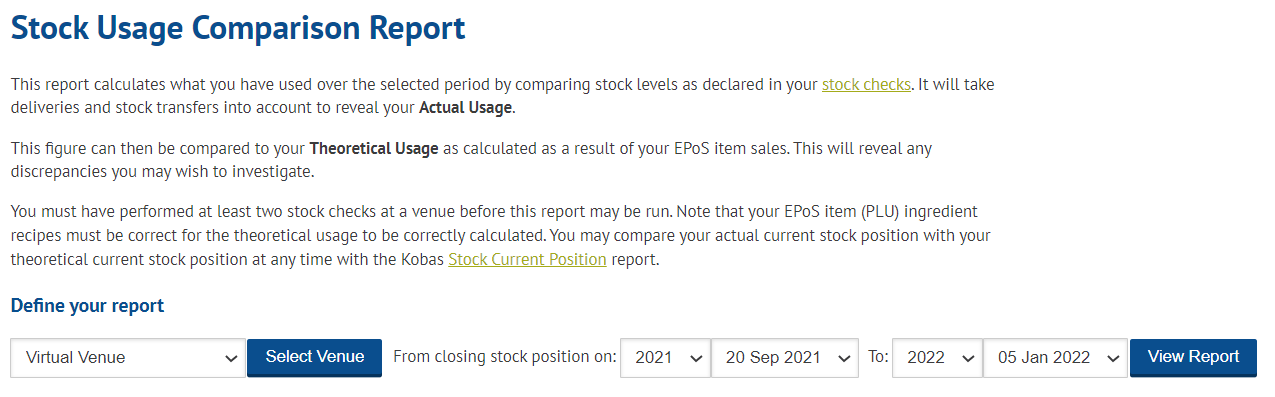
Once you have the correct options, press View Report.
This will first bring you to the Headline Data:

The pie charts will show the 9 top categories and group the other categories as "Other" to ensure the graph is useful. We can see information presented in various formats here, relating to all categories in this venue. Scrolling down, you will see a summary table for your Lead Types and the Ingredient Categories, which both work in the same way:

Note: Stock calculations are significant calculations and do not happen instantly. Once they have been completed, the Net Revenue in this report, will match that in Revenue Reports such as Cash Log and Item Sales.
Here you can see various values (pressing the info bubble will give you definitions of each column) relating to each Lead Type or Category. You can also see at the bottom of the time, net venue generated by both "items not stock checked this period" and "EPoS items with no recipe".
The Refunds line is present because when an ingredient is sold, the stock usage is processed. However, when an item is refunded, the stock doesn't get "added" back to the system, as it has most likely still been used. Therefore, this monetary value is simply to ensure that your GP calculations are accurate by taking into consideration monies refunded back to a customer for specific items.
Top Tip: Any figure that is underlined is a hyperlink to further information.
Clicking the Lead Type or Category will open a further table below that drills down further into specific items in the category.
Note: You can export this report as a CSV spreadsheet and see the information from the main table and the pop-up in once place. This may make spotting trends, and investigating several rows much easier.
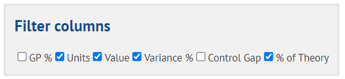
When this expansion happens, you will also see a Filter Column box appear (see below). This helps to thin down the information presented on the screen, to the metrics your business uses to measure stock. For instance, your organisation may work on a unit variance by percentage only, so you may untick the other columns, to make the information easier to use. In this demonstration, we have the following options selected:
Top Tip: It's really useful to see the full table to hide the full navigation bar on the left-hand side by pressing this button:


In this report, we can now see a lot of information relating to the ingredient usage between the current and last Stock Check. To understand our current variances (between the Theoretical and Actual holding stock), we need to focus on the Usage Variance column. If we click on the Variance % sub-heading, the table will sort by that heading (this applies to any heading too). Positive variances (where you are up) are shown in green, and negative variances (where you are down) are shown in red. You will then have items at the top of the table and the bottom of the table that require investigation.
The variance presentation can be reversed (where negative variances would be in green) by activating a setting within Kobas System Preferences.
Step 2: Variance investigation
In this example, let's take a deeper look at Desperado's variance, by clicking on any of the values under the Usage Variance columns. A pop-up with further information will appear:

Top Tip:
At the top of this pop-up, you will see the term Average Ingredient Cost. Therefore, if you have the same ingredient with different costs still to be used in this period from the same or different supplier, this figure may not match what is set in the Ingredient page. This is because this is worked out as an accurate average, and expressed as one size.
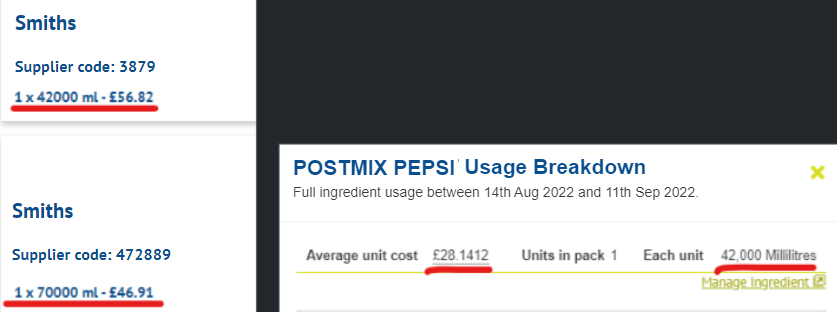
The breakdown in the above example is correct because:
- We take an average of the ingredient cost price, and will average across the two.
- In this period, the venue only had the 7L ingredient delivered. But the 4.2L ingredient is the default.
- 7000ml / 42000ml = 0.6 (so the larger size is 0.6 of the smaller)
- £28.14 is 0.6 of £46.91
If this doesn't seem to be as expected, checking Pricing and Cost Price history of EPoS items, Modifiers and Ingredients would be a good place to check first, followed by transfers between venues where different costs apply.
Various terminology is explored with "info" bubbles which you can hover over. On this screen, you are looking for any information which stands out as possibly incorrect. An example could be no deliveries are showing, and you think it's likely you would've had some; or an unusually high or low closing/opening stock, or stock usage figure. The Manage Ingredient link will handily take you to the ingredient's setup page, where navigating to the Recipe tab will show you where the ingredient is used on your EPoS.
Always check your Pending Orders and Transfers Dispatched but not received as if these processes aren't completed, this will negatively effect your stock.
Control Gap
Step 3: Error correction
When you have located errors, you will then need to amend those issues so that the report can be re-run with more accurate figures.
Common errors found during stock variance investigation:
- Missing or inaccurate stock deliveries recorded on Kobas
- Sales not recorded or inaccurate through EPoS (This isn't possible to rectify. We would suggest adding the items back into your stock count, and run items through EPoS now, so they are accounted for in the next Stock Check).
- Stock usage not logged or inaccurate on Kobas
- Incorrect or missing recipes on EPoS Items, Batches or Modifiers.
- Incorrect or missing information in the Stock Check
- Ingredients and/or suppliers set up incorrectly
Note: There are several Staff User Permission Levels that dictate who can edit these elements on the system. Furthermore, Stock Checks and Deliveries can be restricted so that they cannot be edited after a certain number of days (within Kobas System Preferences), unless the user has the ability to override (set within Permission Levels).
Step 4: The final report and exporting
Once you are happy that you have an accurate SUCR, you have completed the process, and you can continue with your internal processes for the end-of-period stock reporting.
You can export basic information from the report, more details are available here.
Third-party stock auditing
Some hospitality businesses employ or contract auditors to validate the findings of internal management stock checks and associated financial analysis. Kobas offers an export of the Theoretical headline figures within the Stock Usage Comparison Report as mentioned above. These can be exported and manipulated to upload into a third party stock auditing system as required.