Who can use this feature:
🥇Accounts on the Starters, Mains or All You Can Eat plan.
🔐Users with access to Reports permission.
Jump to:
Introduction
When you run a hospitality business, there is a lot of information that is processed about your operations. Having aspects of that data in various forms allows you to make informed business decisions. It's this need that has driven the development of our Insights pillar of Kobas, our reporting.
This article is intended for those clients and managers who have used Kobas for some time, but are looking at what places within Kobas could you find useful information to develop and run staff incentives and some other KPI visibility.
If you have any suggestions or ideas for this article, have a chat with your Account Manager or the Support Help Desk.

Staff incentive information
| Staff Productivity |
The Weekly Business Summary Email provides you with a breakdown of staff performance for the week including total amount of net sales, number of shifts worked, and the number of hours worked. This allows you to see productivity of your staff relative to their working hours, perfect for rewarding those who put through more sales per week.
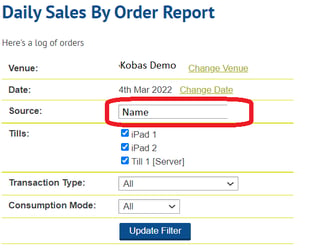
You can also use the Daily Sales by Order report to fill out the same information per day, if you wish to reward those who put through more sales or orders on a given day.
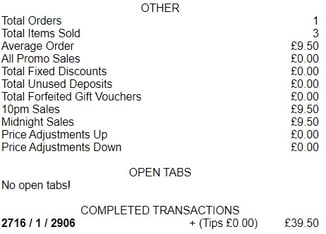
Finally, you can also see some relevant info per staff member per day by going on EPoS to Admin > User X Report. This is an example of a User X showing the transactional info by one staff member on that day.
|
| Item Sales per date range / venue |
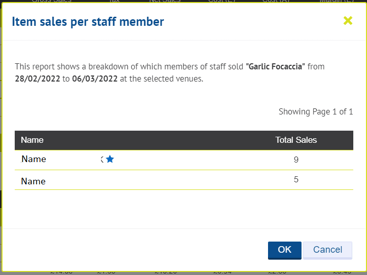
The Item Sales (All) By Date report allows you to see how many items have been sold by each staff member per day or in a date range. This will allow you to run competitions such as looking at who sells the most specials, or other items. When you have run the report, click on the number of items sold on any line for this detail box:
|
| Modifier Sales / usage per date range or venue |
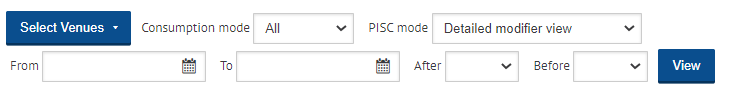
The Item Sales (All) By Date report also allows you to view all Modifiers, whether they create a price change or not. Also, by selecting Detailed Modifier View, you can see a detailed analysis of Modifier performance (including by staff member). |
| Punctuality and Sickness |
You can view your teams punctuality and sickness record in one place by accessing the Punctuality & Sickness report. Rewarding good punctuality and lack of sickness could improve morale and reduce staff no-shows and increase morale.
|
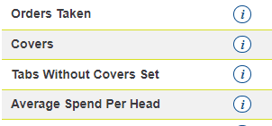
| Spend Per Head |
This is difficult to calculate due to the many variables such as do we include diners and drinkers, and the difference between tabs, orders and those placed online. Within the Cash Log Report, you can see information that gives you rough SPH figures.
|
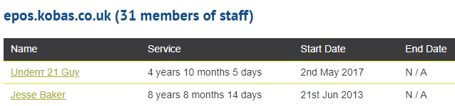
| Staff longevity |
The Length of Service report shows you handy information so you don't miss milestones worth celebrating:
|
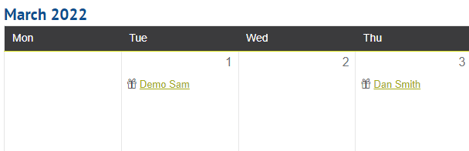
| Staff birthdays and work anniversary |
If you go to Teams > Staff Calendar, even if you don't use our Rota's module, you will be able to see your teams' Birthdays and Work Anniversaries, and help them to celebrate accordingly:
|


Other KPI information
| Gross Profit | Our Stock Usage Comparison Report allows you to see your Gross Profit and Margins expressed in various ways and in various headline or granular detail forms. |
| Revenue | A staple of analysing performance is the simple money taken over the counter (or in the cloud!). You have some useful quick reports you can add to your homepage that summarises this information, as well as Weekly/Daily emails. However, you can always check out our suite of Revenue Analysis reports. |
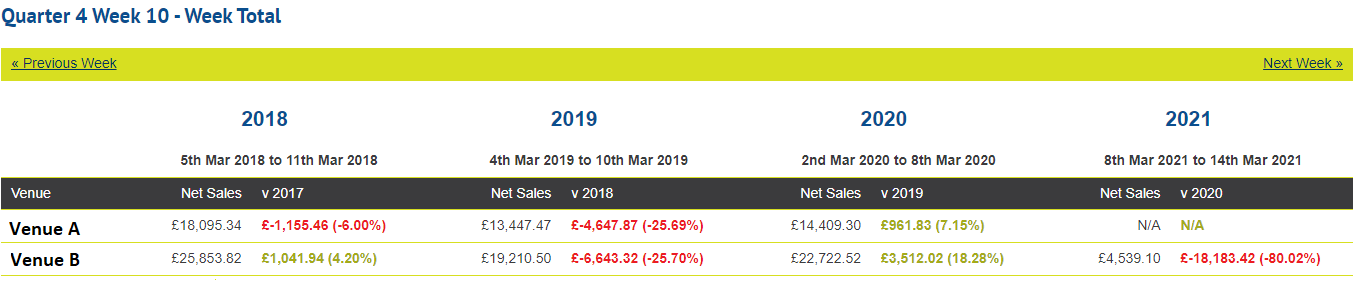
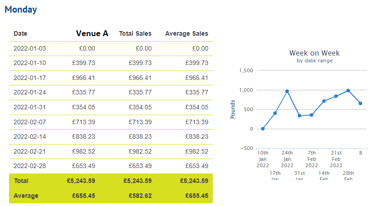
| Sales vs Last Year or Week |
If you head over to Reporting > Revenue Analysis > Year on Year, you'll see:
And then Week on Week:
|
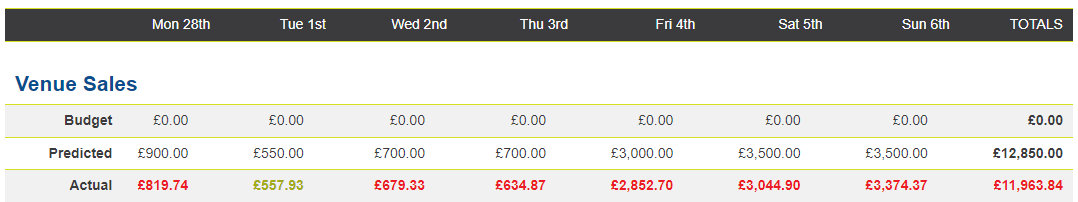
| Sales vs Forecast |
If you go into the Hours Worked section of rotas, and choose a date or week that has past, you'll see sales figures against forecast:
|
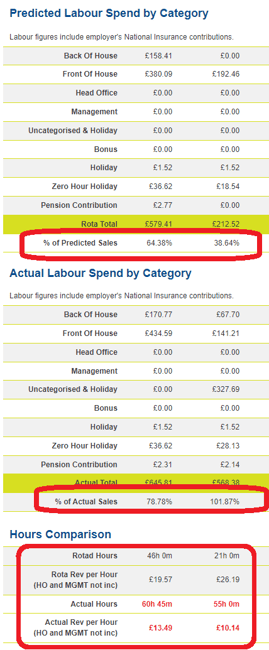
| Wage costs |
In the venue specific Hours Worked sections, you can see the rota wage costs (expressed as a monetary value and as a percentage of sales) vs the actual. You can also see some direct comparison figures:
|
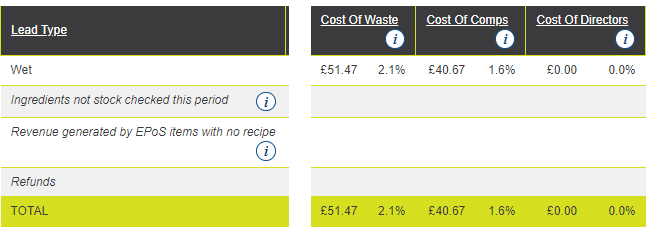
| Cost of sales, discounts, wastage and comps |
Information around these costs to the business can be found in both the Stock Usage Comparison Report:
And in the Discount Report where cost of discounts, as well as comp, waste, director are summarised (with their detailed reasons if available). |