Who can use this feature:
🥇Accounts on the Starters, Mains or All You Can Eat plan.
🔐Users with access to Reports/Operation Analysis permission.
Jump to:
- Introduction
- Incidents Report
- Petty Cash
- Suppliers Stock Deliveries Report
- Stock Current Position
- Stock Ingredient Movement
- Stock Transfers
- Stock Usage Comparison
- Stock Usage History Report
Introduction
You will find these reports by going to Reports > Operations Analysis
You can view all of the elements of completed Daily Tasks (Opening, In-Shift, and Closing) by hovering over the Daily Tasks menu and selecting the relevant option.
You can also find reporting on Historical Stock Usage under Operations > Stock Usage.
It is also worth looking at the reports available within our Scheduled Report Engine that relate to operations.

Note: Please note that reports will require the correct Permission Levels to view.
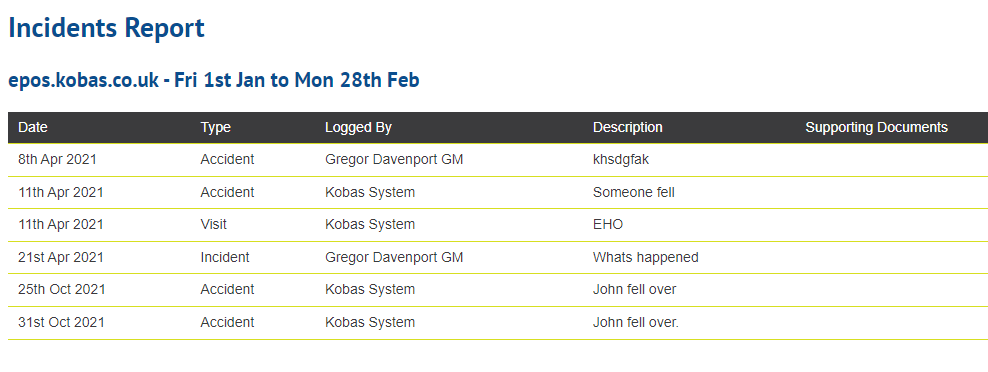
Incidents Report
This report is very simple; you will need to select a date range and a venue, and you will be able to see and download all the recorded incidents in that data range. You can also see the uploaded documentation.
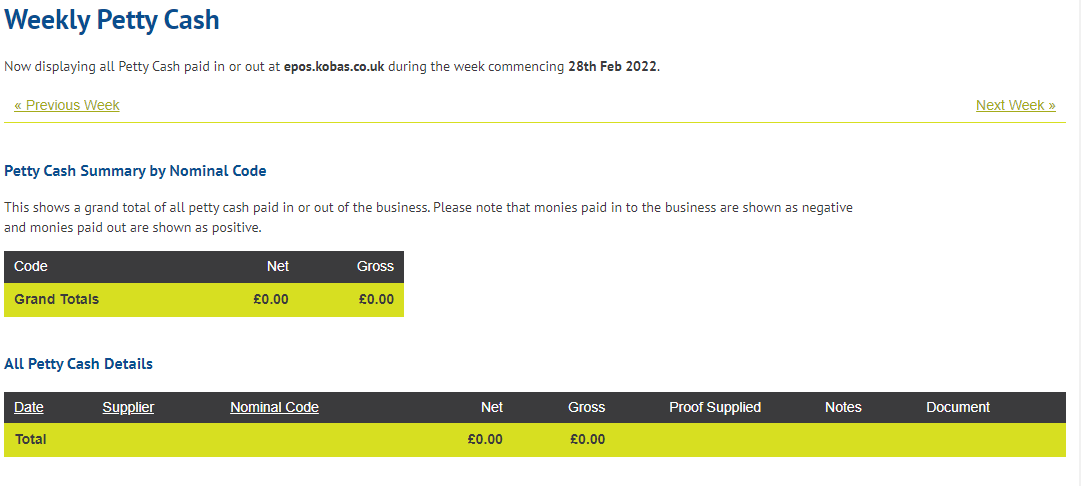
Petty Cash
This report allows you to view the petty cash logged at the selected venues, you can choose week-by-week, venue-specific, or all venues, and either view on-screen or export.
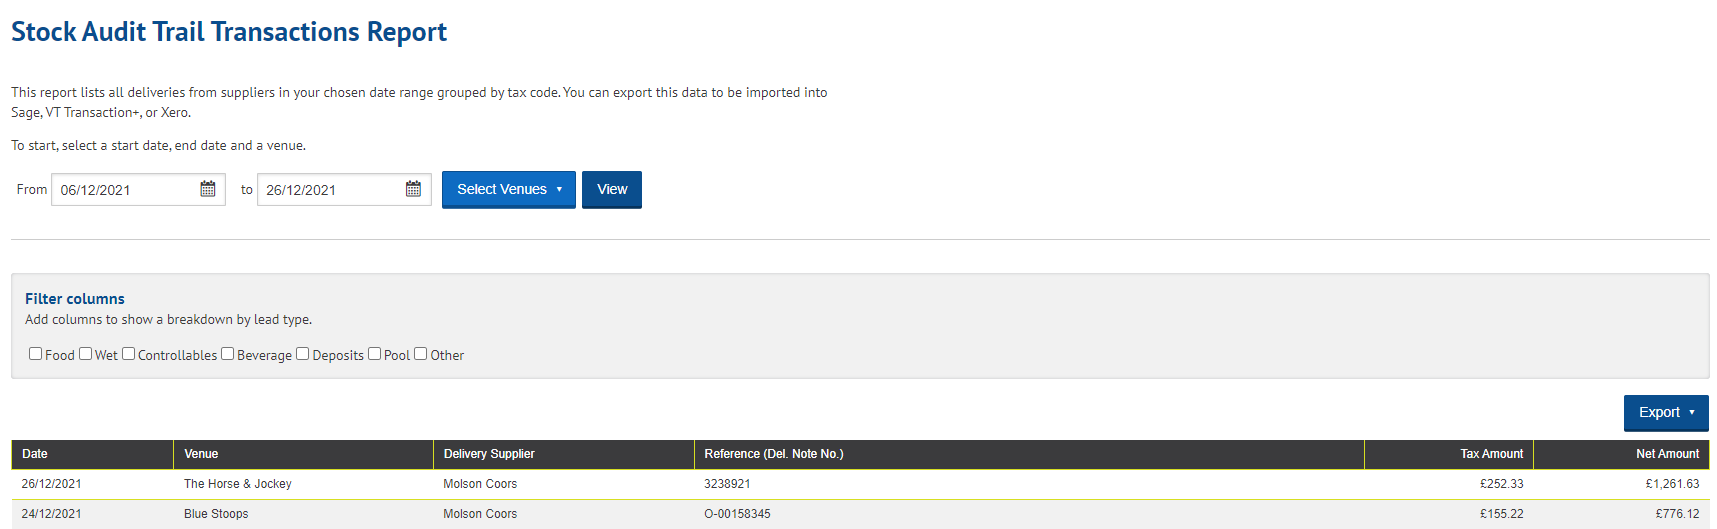
Suppliers Stock Deliveries Report
This report lists all deliveries from suppliers in your chosen date range grouped by tax code. You can export this data to be imported into Sage, VT Transaction+, or Xero.
Stock Current Position
Use this report to see how many of each of your ingredients you should have in stock. Your current stock is estimated by taking your most recent stock check figures, adding deliveries and transfers in and removing transfers out and theoretical usage (which comes from the sales data uploaded from your tills).
Choose a venue and stock ingredient category below. Stock batch categories cannot be reported here as more product stock could be made in your venue at any time. This report will split your ingredients between their various suppliers, where they have more than one.
Stock Ingredient Movement
This report can be loaded for 9 venues on the screen, or all venues if exported, for any date range. The report shows theoretical stock usage by ingredient. You can see the average, maximum and last delivery information. This is a good way to review and compare venue ingredient ordering habits across a period, and spot anomalies.
This report now shows Total Delivery Value which would be useful to see how much of an ingredient has been ordered per venue (or total across the group). This is useful for negotiating with suppliers, amongst other reasons.
We have made the visual interface of the report easier, with jump buttons to categories. You can also view a breakdown of where the sales have come from for each venue from this report.
Stock Transfers
Select any combination of venues to see stock transferred between them in a specific date range. Click on a figure for a detailed breakdown of stock transferred.
Stock Usage Comparison
This is the report that you will use the most in order to identify, analyse and understand/explain variances between your Stock Checks.
Your first step will be to define one venue and then choose the Stock Checks you wish to compare between. It's worth noting that you will only be able to compare Lead Types that have been counted in both of the Stock Checks you select to compare.
Headline information will be presented first visually at the top, showing breakdowns of GP, revenue by Lead Type, Category and Theory usage split.
The first table is the "Lead Type Summary". This is a summary of ingredient usage grouped by stock ingredient category lead type. The net revenue figures are generated from the ultimate net sale price of the PLU in proportion to the ingredient's proportion of the cost of goods required for that sale.
You then get the "Ingredient Category Summary". This is a summary of ingredient usage grouped by stock ingredient category. The net revenue figures are generated from the ultimate net sale price of the PLU in proportion to the ingredient's proportion of the cost of goods required for that sale.
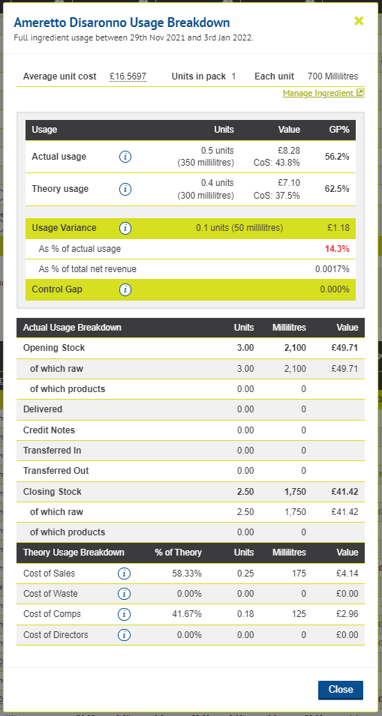
Clicking on each Category will open a further table with each item in that category. You can filter the columns shown, which is useful in reducing the amount of information shown. For example, if you work on Variance by Units, Percentage, or Value, you can hide the columns you don't use. This is a useful place to drill down on your variances, as selecting the hyperlink on any of the values will open the detail screen:
This page will also note any lead types or categories that cannot be displayed as they weren't counted in one or both of the selected Stock Checks.
Export
You can also choose to export this report, which will export to a CSV spreadsheet the following columns:
- Ingredient ID, Name, Unit Size and Category.
- Theoretical usage (which is sales) in units, Waste units, Comp units, Director units
- Actual usage (which is all usage based on Stock Check) in units, and Actual GP
- Net Income
For more guidance on Stock Checks and subsequent analysis and investigation, please visit our Training for Managers guide. You can also check out our Stock Analysis guide.
Stock Usage History Report
This report will provide a detailed list of how your stock usage has been logged, through sale, waste etc, with reasons lists. It will say who logged this and when. You can filter by venue, usage type and date ranges. This can be viewed on-screen or exported.